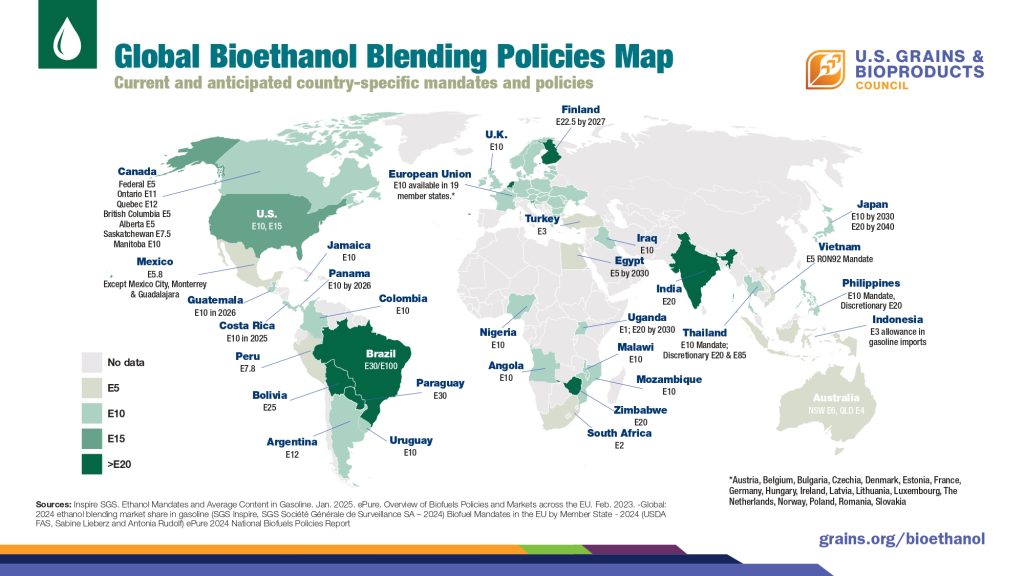
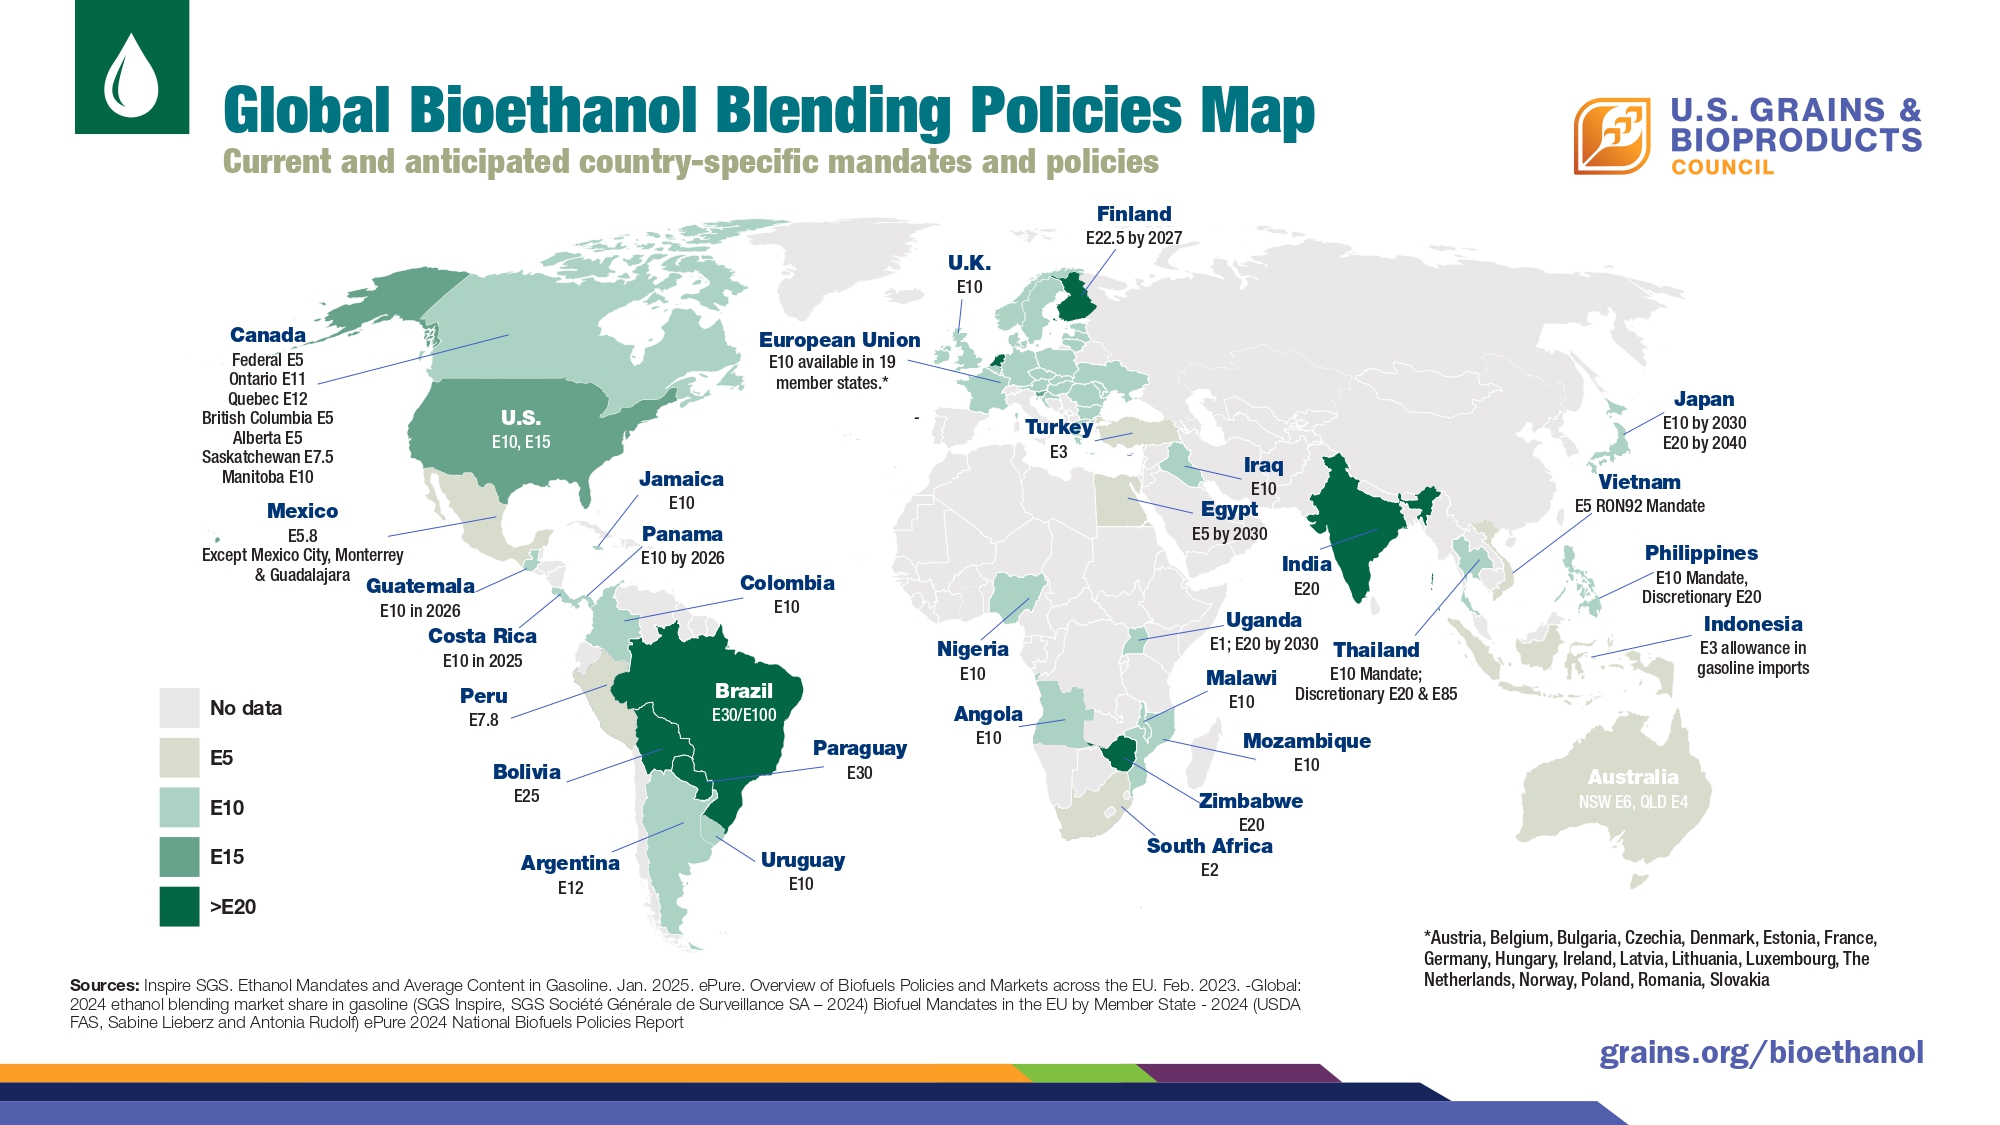
Global Bioethanol Blending Policies Map Download Image USGC-Bioethanol-Blending-Maps-PPT-07-09-25-FINAL_01 Download Infographic Post navigation Previous PostPrevious U.S. Corn Role In Mexico TradeNext PostNext Global Bioethanol Effective Blend Rates